
Pi Day 2026: Calculating Pi with the Mandelbrot Set
By Dan Zaharopol, BEAM’s Founder and CEO
The Mandelbrot Set is one of the most famous images in mathematics. Even if you never studied much math, there's a good chance this looks familiar:

Created by Wolfgang Beyer with the program Ultra Fractal 3. - Own work, CC BY-SA 3.0, https://commons.wikimedia.org/w/index.php?curid=321973
The Mandelbrot Set is a fractal, which means it has a repeating pattern to it. No matter how much you zoom in, the same kind of complex structure recurs. But where does it come from? And what could it possibly have to do with 𝜋?
Where the Mandelbrot Set comes from
You may have heard, at some point, about complex numbers. By way of analogy, we consider negative numbers so that there's a way to subtract any two real numbers, such as, \( 3 - 8 = -5 \). In the same way, we consider complex numbers so that we can take the square root of any real number, such as \( \sqrt{-4} = 2i \). The i stands in for a square root of -1. (It's one of two square roots; the other is –i, because \( (-i)^2 = (-i)(-i) = i^2 = -1 \).)
Being allowed to take the square root of -1 might sound strange, but in fairness, negative numbers sound pretty strange to a 10 year old! You can define a fully consistent set of rules for complex numbers, and you can use them just like you use any number. Maybe it's weird because whole numbers are used to measure something physical (counting how many objects there are), and real numbers are used to measure something physical (lengths), but complex numbers aren't really used to measure anything, at least not unless you start doing quantum mechanics or studying electric currents!
Mathematicians often ask themselves how something behaves when you repeat a process many times. For example, say that you take a real number and keep squaring it over and over again. If you start with 2, it gets infinitely large:
$$ 2 \;\; \to \;\; 4 \;\; \to \;\; 16 \;\; \to \;\; 256 \;\; \to \;\; … $$
But start with 1 and you don't go anywhere!
$$ 1 \;\; \to \;\; 1 \;\; \to \;\; 1 \;\; \to \;\; 1 \;\; \to \;\; … $$
That was boring! Start with -1 and you cycle back and forth:
$$ -1 \;\; \to \;\; 1 \;\; \to \;\; -1 \;\; \to \;\; 1 \;\; \to \;\; … $$
Start with \( \frac{1}{2} \) and it gets smaller and smaller, closer and closer to zero:
$$ \frac{1}{2} \;\; \to \;\; \frac{1}{4} \;\; \to \;\; \frac{1}{16} \;\; \to \;\; \frac{1}{256} \;\; \to \;\; … $$
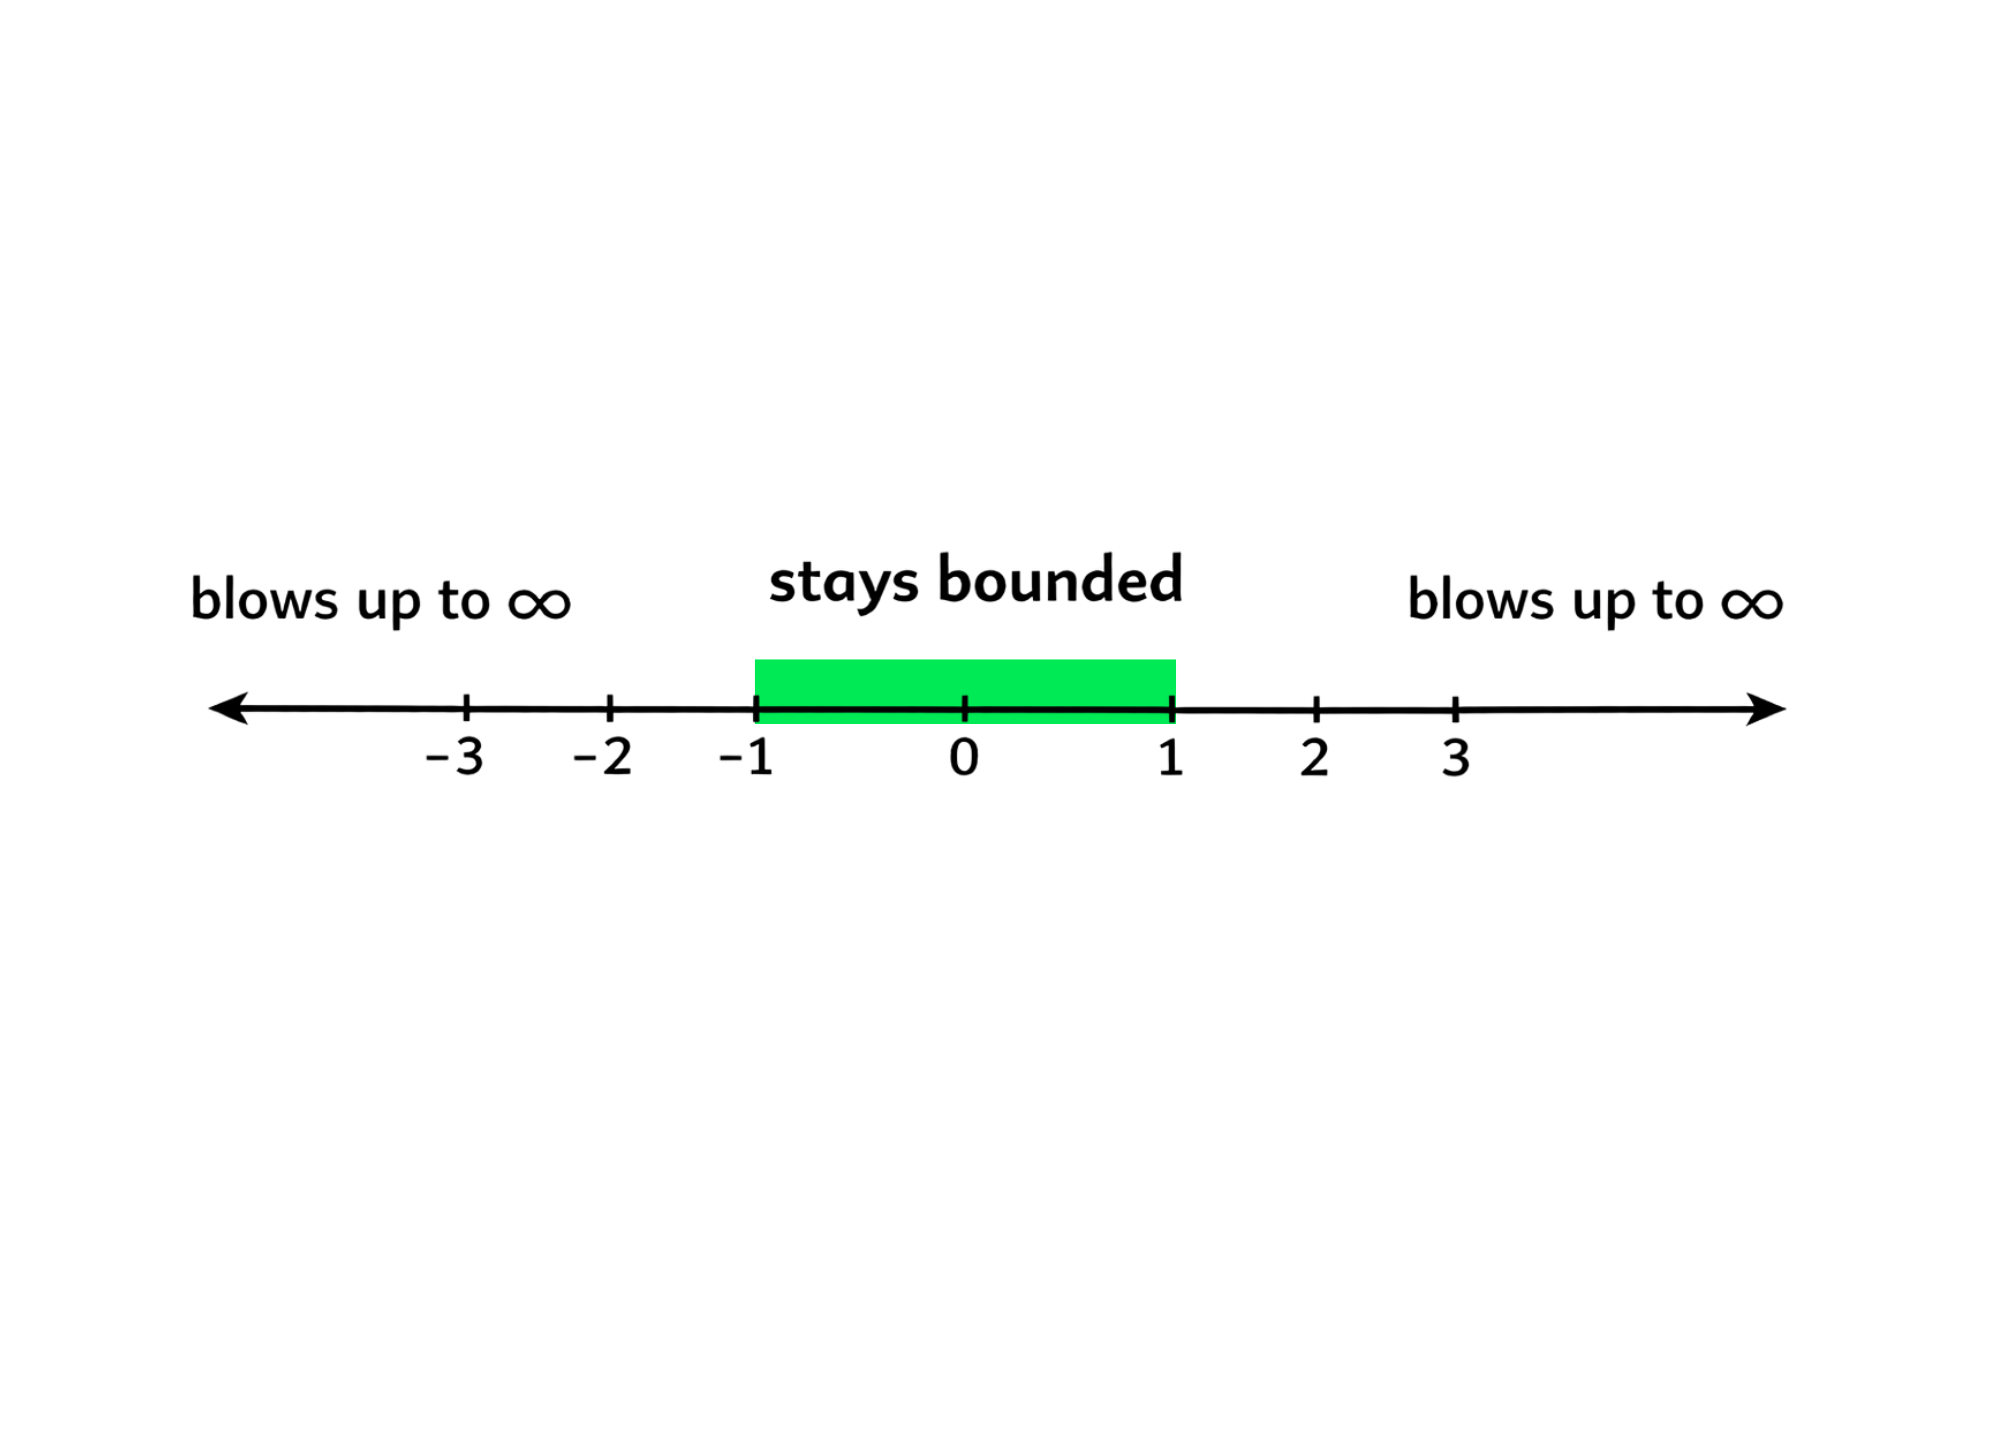
So interesting things happen when you do something over and over again! You can actually draw a simple diagram showing which numbers stay bounded and which numbers blow up to infinity:
In fact, we'll do one more example. Start with i and you quickly get back to a repeating pattern:
$$ i \;\; \to \;\; -1 \;\; \to \;\; 1 \;\; \to \;\; -1 \;\; \to \;\; … $$
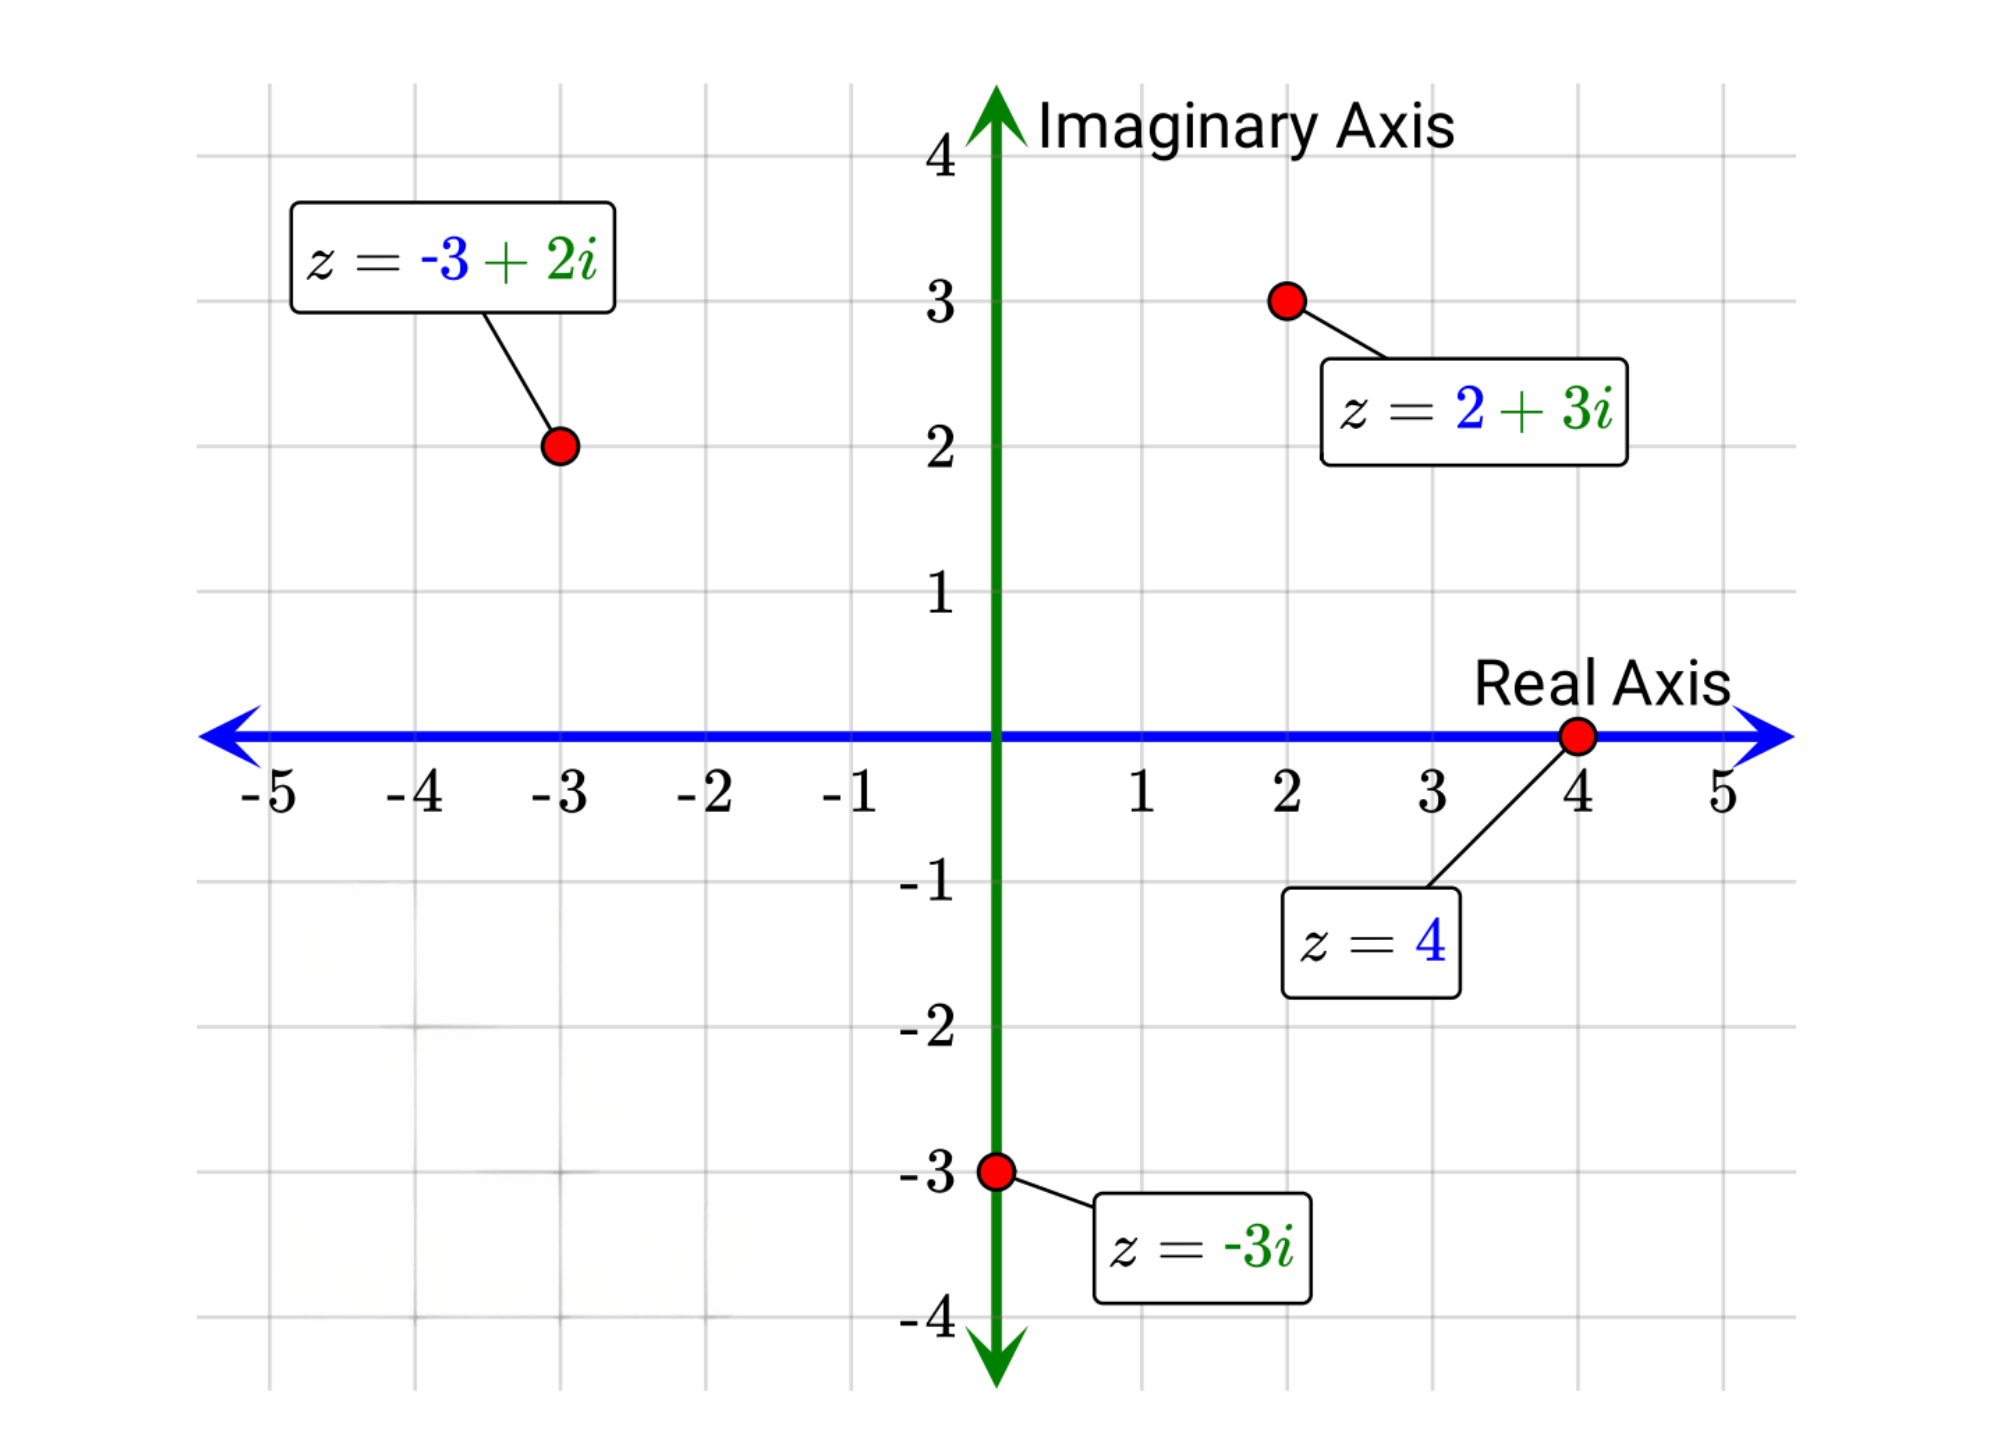
That diagram we did before with the real numbers? It turns out you can do the same thing with the complex numbers. Just like the real numbers make a line, the complex numbers make a 2-D plane. Any complex number can be written as \( a+bi \). In the plane, you make one axis represent real numbers and the other represents the part with i (which is called "imaginary") and you can plot any complex number on the plane:
That's pretty interesting, but what does this have to do with the Mandelbrot set?
Well, before, we talked about studying what happens when you repeat a process over and over again. To get the Mandelbrot Set, look at the process of taking any complex number c, and then repeatedly squaring it and adding c again. For example, say that you start with i. Then you get:
$$ i \;\; \to \;\; i² + i = -1 + i \;\; \to \;\; (-1 + i)² + i = -i \;\; \to \;\; (-i)² + i = -1 + i \;\; \to \;\; … $$
So if you start at i, it repeats over and over and doesn't blow up! On the other hand, if we'd started at 1, it would absolutely blow up, going from 1 to 2 to 5 to 26 and so on.
Well, then it's totally natural to ask the question, which imaginary numbers blow up, and which don't? And what happens if you draw that out on the plane like we did above? Well, if you draw the numbers that don't blow up, you get this:
Created by Wolfgang Beyer with the program Ultra Fractal 3. - Own work, CC BY-SA 3.0, https://commons.wikimedia.org/w/index.php?curid=321973
Oh, wait! That's… that's the Mandelbrot set!
This is pretty amazing. We started with a simple process: repeatedly square and add a set number. Then, look to see if it keeps getting larger and larger. The results of that simple process, however, are incredibly complex. If you keep zooming in, it becomes more elaborate, revealing detailed structures at each level.

By Simpsons contributor at English Wikipedia - Transferred from en.wikipedia to Commons by Franklin.vp using CommonsHelper., Public Domain, https://commons.wikimedia.org/w/index.php?curid=9277589
It's one of the truly magical things about mathematics: Something intricate and complex emerges from a very simple process. That's the Mandelbrot Set (and indeed, many fractals).
Wait, what does that have to do with π?
It turns out that if you approach the Mandelbrot Set in a very particular way, the digits of π pop out quite naturally from its structure! This floored me when I first discovered it, and you now have the tools to follow along and understand why. I can't explain it better than where I first learned it, so I will close this post by sharing this absolutely lovely video from Numberphile.
Want to go deeper still? Check out this video with more footage from Numberphile or this somewhat more technical video showing how to get the digits of 𝜋 from the Mandelbrot set.
Looking for a Pi Day challenge? Check out this blog post for some pi-themed math problems for Pi Day!